Geavanceerde Analytics Dashboard
Transform raw customer feedback into actionable intelligence — sentiment analysis, trend tracking, and export-ready reports built for Dutch webshops.
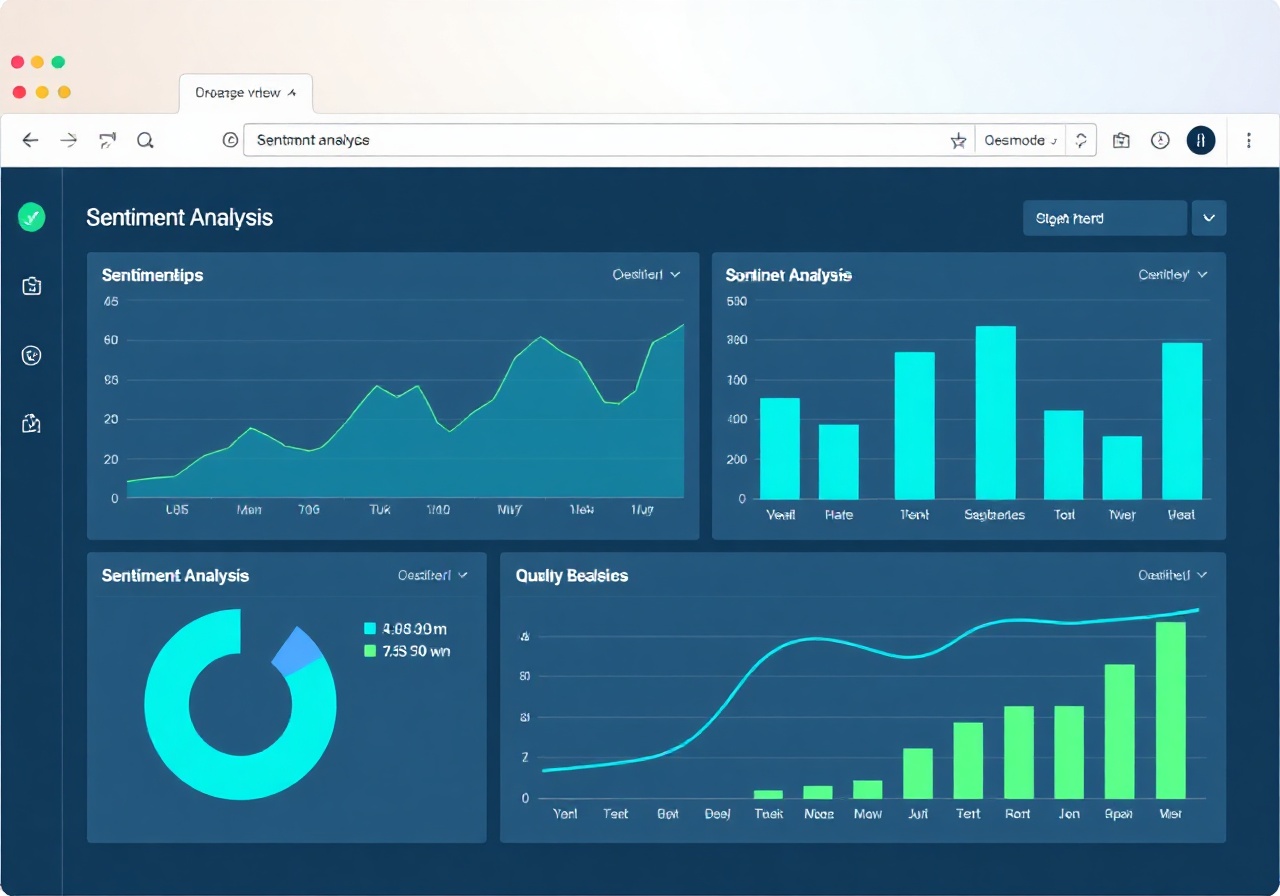
Request a Live Demo View PricingDashboard Preview
See every voice, every signal, in real time
Your FeedBackNL dashboard aggregates responses from on-site widgets, post-purchase surveys, and NPS prompts into a single pane. Filter by date range, webshop, language, or campaign — and drill into individual verbatim comments with one click.
The interface is fully bilingual. Toggle between Dutch and English labels without losing any data. All exported reports preserve the original language of each response, so your team in Utrecht and your agency partner in Amsterdam can work from the same source.
Core Metrics
What the dashboard measures — and why it matters
Four pillars of feedback intelligence, updated continuously as new responses arrive through your widget.
Sentiment Analysis
Natural-language classification of every open-text response into Positief, Neutraal, or Negatief. The engine is trained on Dutch e-commerce language — it understands phrases like "levering was een stuk langzamer dan verwacht" and flags them accurately. Confidence scores are shown per comment so you can audit edge cases.
Trend Tracking
Time-series charts for NPS, CSAT, and response volume. Set up trend alerts: if your weekly NPS drops below 42 or if negative sentiment exceeds 18 %, your team at Groenewoud BV gets a Slack notification within five minutes. Compare week-over-week or month-over-month to spot seasonal patterns.
Export & Reporting
One-click export to CSV, PDF, or Excel. Schedule automated weekly digests that land in the inbox of your account manager at RetailPulse Amsterdam. Reports include raw responses, sentiment tags, and trend summaries — all formatted with Dutch date conventions and euro pricing by default.
Nederlandse Taalondersteuning
Every label, filter option, and report heading can be displayed in Dutch. The sentiment model recognises regional variations — including informal spelling and common webshop terminology — so your analysis stays accurate whether customers write from Groningen or Limburg. Switch languages in the dashboard settings without reimporting data.
Geavanceerde Analytics Dashboard
Transform raw customer feedback into actionable intelligence — sentiment analysis, trend tracking, and export-ready reports built for Dutch webshops.
Request a Live Demo View PricingDashboard Preview
See every voice, every signal, in real time
Your FeedBackNL dashboard aggregates responses from on-site widgets, post-purchase surveys, and NPS prompts into a single pane. Filter by date range, webshop, language, or campaign — and drill into individual verbatim comments with one click.
The interface is fully bilingual. Toggle between Dutch and English labels without losing any data. All exported reports preserve the original language of each response, so your team in Utrecht and your agency partner in Amsterdam can work from the same source.
Core Metrics
What the dashboard measures — and why it matters
Four pillars of feedback intelligence, updated continuously as new responses arrive through your widget.
Sentiment Analysis
Natural-language classification of every open-text response into Positief, Neutraal, or Negatief. The engine is trained on Dutch e-commerce language — it understands phrases like "levering was een stuk langzamer dan verwacht" and flags them accurately. Confidence scores are shown per comment so you can audit edge cases.
Trend Tracking
Time-series charts for NPS, CSAT, and response volume. Set up trend alerts: if your weekly NPS drops below 42 or if negative sentiment exceeds 18 %, your team at Groenewoud BV gets a Slack notification within five minutes. Compare week-over-week or month-over-month to spot seasonal patterns.
Export & Reporting
One-click export to CSV, PDF, or Excel. Schedule automated weekly digests that land in the inbox of your account manager at RetailPulse Amsterdam. Reports include raw responses, sentiment tags, and trend summaries — all formatted with Dutch date conventions and euro pricing by default.
Nederlandse Taalondersteuning
Every label, filter option, and report heading can be displayed in Dutch. The sentiment model recognises regional variations — including informal spelling and common webshop terminology — so your analysis stays accurate whether customers write from Groningen or Limburg. Switch languages in the dashboard settings without reimporting data.